
ISSN (0970-2083)
ISSN (0970-2083)
1Central Pollution Control Board New Delhi, India
2Birla Institute of Technology and Science, Pilani 333 031 India
Received date 10 March, 2015; Accepted date 20 May, 2015
Visit for more related articles at Journal of Industrial Pollution Control
Environmental pollution remains a serious issue in the developing world, affecting the lives of billions of people, reducing their life expectancy, and damaging children’s growth and development. India is facing the challenge of industrial pollution at an alarming rate. This has made the constant surveillance of environmental characteristics a necessary task. There is an urgent need to identify critically polluted areas and identify their problematic dimensions. The comprehensive environmental pollution index (CEPI) helps in quantifying the environmental health of the critically polluted areas by synthesizing available information on environmental status by using quantitative criteria, encompassing air, water and land. Based on this, a fuzzy rule is developed to assess the index to classify the various industrial clusters’ pollution level. This study deals with delineating the environmental pollution among various industrial clusters in Central India. Further to develop a more in-depth study, the average CEPI of the clusters are normalized and hence, formulating the base to integrated fuzzy assessment model. The paper aggregates to various techniques for analysing the environmental pollution caused by the various industrial clusters and can be applied to a larger scale for further scope.
Environmental Impact Assessment; Industrial clusters, Fuzzy decision analysis, Integrated fuzzy assessment model, Central India
Environment comprises of the surroundings for sustainability of living beings. With rapid urbanization and excessive industrialization, the environment is tarnishing rapidly. Its pollution comprises of introduction of harmful pollutants in air, water and land. Environment pollution is a prevalent concern across the globe affecting the lives of millions of people physically and economically. It is assessed by World Health Organization (WHO), about one-quarter deaths across the globe are due to environment pollution. It is, hence the need of hour to scrutiny the critical environment situation and curb the factors leading to such conditions at the source itself.
India, being a developing nation, is facing severe environment pollution owing to various industrial activities, urbanization and precipitous population growth. The industries are classified as ancillary, small, medium and large scale-industries. Around 560,000 companies are registered under the Companies Act, 1956. Hence, there should be accurate measures taken to achieve sustainable development. To undertake this goal, the first step is to prepare a baseline study to delineate the pollution intensity across various industrial areas/clusters. The Comprehensive Environment Pollution Index (CEPI) aids in quantifying the environmental pollution for air, water and land using various statistical and mathematical criteria.
In this study, the central India is concentrated comprising of total seven industrial sectors, Dewas, Gwalior, Indore, Nagda and Pitampur in Madhya Pradesh & Bhillai and Raipur in Chhattisgarh. The pollution is studied separately for air, water and land, and lastly, aggregated to obtain the average CEPI value for each of the industrial cluster. Next step is to formulate a fuzzy rule base for the obtained values of air, water and land CEPI values so as to generate a proportional list of the areas. This step helps in demarking the pollution intensity in the various clusters using fuzzy decision analysis.
Further to develop a more in-depth study, the average CEPI of the clusters was normalized and hence, formulating the base to integrated fuzzy assessment model. This model constitutes an assessment grade and a membership attached with the grade. The weights to each of the grade assigned help to obtain a final score for the cluster. Therefore, the paper deals with an integrated fuzzy assessment model for an industrial sector including the various sustainability assessment indicators. The paper aggregates to various techniques for analysing the environmental pollution caused by the various industrial clusters and can be applied to a larger scale for further scope.
Comprehensive Environmental Pollution Index
The Comprehensive Environment Pollution Index (CEPI) aids in quantifying the environmental pollution for air, water and land using various statistical and mathematical criteria. The details of the topic can be found elsewhere (CPCB, 2009).
The CEPI is an efficient and operative method to analyze real life environmental pollution clusters. It helps to portray the environmental situation following the procedure of source, pathway and receptor. With an increase in CEPI, the environmental stability of the region is compromised and effecting the health and well-being of proximate areas. In nutshell, the procedure deals with three aspects viz., pollutant (A), pathway (B) and receptor (C). For each aspect, two or three factors are considered and further, either addition or multiplication is performed depending on the factors, as explained in Table 1. Also, an additional high risk element (D) is considered explained in Table 2, for inadequacy of large, medium and small scale industries; also due to unorganized sector. The common facilities include the construction of Common Effluent Treatment Plant (CEPT), Air Pollution Control Devices (APCDs) and unorganized waste disposals.

Table 1. Factors for the three aspects Pollutant (A), Pathway (B) and Receptor (C)

Table 2. Score for additional high-risk element (D)
After calculation of the sub-index score, the final step is to calculate the average CEPI value for the industrial cluster, which is calculated using the formula given below:

where, im = maximum sub-index; and i2 and i3 are sub-indices for other media.
Integrated Fuzzy Assessment Model
The integrated fuzzy assessment model is the application of fuzzy set theory, in which the aspiration levels concerning different objectives and classifications are not ordinary numbers, rather fuzzy numbers. The details of the topic can be found elsewhere (Sakawa 1993; Singh et al., 2007; Singh 2008 and Singh and Shrivastava, 2014).
For example, to assess the water quality of a stream, it is difficult to define a boundary between higher and lower water quality. There is a kind of ambiguity generated because of the absence of clear defined boundary between these objects. Fuzzy logic is a super set of conventional (or Boolean) logic and contains similarities and differences with Boolean logic. The traditional Boolean logic uses 0 or 1 to describe the membership relation between one specific object and the class of this kind of objects. When, the object belongs to that class, the value of the characteristic function that describes the membership relation between one specific object and classification is 1, whereas the value is 0 when the specific object doesn’t belong to the class completely. Though, with fuzzy logic it is easy to calculate the degree of an object to which it is a member of the set or not. The grade of membership function can be achieved by adopting the concept of a membership function to assign a number ranging from zero (absolute not belonging) to unity (fully belonging) according to the degree of belongingness to each element.
Let U = {u} define a finite set (space) of elements representing a particular class. In this concept, μG (U) represents the membership function, i.e. the grade of membership of U in G. There are infinite possible values of membership function of μG (U) belonging to set [0, 1]. For example, U represents the set of various assessment factors to identify status of industrial clusters. The main components consisting of the fuzzy comprehensive assessment model are assessment criteria set, assessment class set, weights set, membership function, fuzzy relation matrix, fuzzy combination and fuzzy evaluation matrix. In this case, there is only one assessment indicator U, depicting the environmental pollution level of the industrial cluster.
Assessment Class Set
The set G is defined as an assessment class set containing of all evaluation classes in which each element represents one evaluation class and is represented as G = {G1, G2, G3}. For example, if water is easily accessible and available, the consumption will be high without bothering much for high savings and exploitation rate. Thus, the assessment set can be high, medium and low.
According to the significance of above assessment factors in the water resource carrying capacity, and consulting other evaluation standards for water resources (Singh, 2008), there are three grades (classes) which are important for describing the significance of the above mentioned seven evaluation factors. The classification of these classes (grades) with respect to each assessment factor is shown in Table 4. Among them, G1 stands for the best situation; it shows the water resources have a great potential to develop, the degree of water resources utilization and the scale of the development are smaller. Therefore, the situation of water resources supply is optimistic. G3 stands for the worst situation; it shows that water resources carrying capacity is close to saturation, the more explanation of water resources will lead to a shortage in water resources and environmental deterioration. The situation between G1 and G3 is G2, it shows that the scale of water resources exploitation and utilization though has reached a certain level but still can be exploited.

Table 3. Calculation of Air CEPI

Table 4. Calculation of Water CEPI
Weight Set
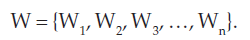
The element weight Wi, represents the weight coefficients of each of the criterion and is represented as
Fuzzy Relation Matrix
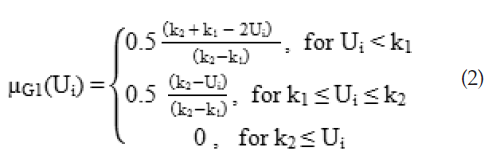
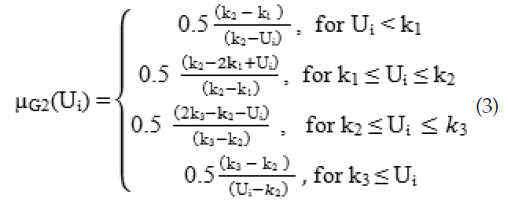
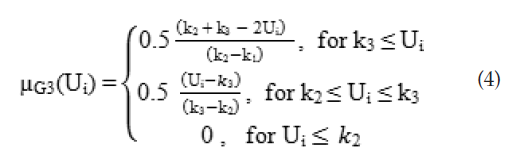
In order to eliminate a possible grade discrepancy of the assessment values with small differences, the membership function should be smoothened out between the grades which can be carried out by the fuzzy algorithm (Singh, 2008). It is assumed that the membership function of the mid-point of the grade G2 (intermediate interval) receives a score of 1, and the membership degree in the two marginal points receive a score of 0.5, and that value descends linearly from the mid-point to these two points. According to the above algorithm and the definition of membership function (Chen, 1994; and Singh et al., 2008), the membership function of the three classification grades with respect to the environmental factor could be constructed by the following formula:
Using the above membership function definition, values for each criteria and each assessment grade is calculated.
Fuzzy Combination and Fuzzy Evaluation Matrix
After obtaining the value of each membership function value for the respective assessment grade, the next step is to formulate a global membership matrix which is product of weights matrix with the fuzzy relation matrix. The integrated fuzzy assessment could be regarded as the following fuzzy combination.
The value of a above is a comprehensive grade based on the final fuzzy combination matrix B. In order to reflect the situation of water resources carrying capacity much better, the grades 0 – 1 are distributed to G¬1 and G3. Accordingly, a1 = 0.90, a2 = 0.50 and a3 = 0.05 This represents quanitatively degree of influence of each assessment criteria of environmental sustainability of the area. The higher the degree of influence, greater the sustainability. The implementation of the fuzzy comprehensive assessment consists of series of steps as shown in Figure 1.

Fig. 1 Flow-chart of Integrated Fuzzy Assessment Model

Fig. 2 Location of industrial clusters in Central India
Application of Integrated Fuzzy Assessment Model
India, being a developing nation, is facing severe environment pollution owing to various industrial activities, urbanization and precipitous population growth. The industries are classified as ancillary, small, medium and large scale-industries. Around 560,000 companies are registered under the Companies Act, 1956. Hence, there should be accurate measures taken to achieve sustainable development. To undertake this goal, the first step is to prepare a baseline study to delineate the pollution intensity across various industrial areas/clusters. The Comprehensive Environment Pollution Index (CEPI) aids in quantifying the environmental pollution for air, water and land using various statistical and mathematical criteria.

Finally, the fuzzy integrated assessment value a is calculated as 
In this study, the central India is concentrated comprising of total seven industrial sectors, Dewas, Gwalior, Indore, Nagda and Pitampur in Madhya Pradesh & Bhillai and Raipur in Chhattisgarh. The pollution is studied separately for air, water and land, and lastly, aggregated to obtain the average CEPI value for each of the industrial cluster. Next step is to formulate a fuzzy rule base for the obtained values of air, water and land CEPI values so as to generate a proportional list of the areas. This step helps in demarking the pollution intensity in the various clusters using fuzzy decision analysis.
Study Area
The Central area comprises of Madhya Pradesh and Chhattisgarh, summing an area to 443,442 sq.km, where M.P. itself is the second largest state in India. The total population of M.P. and Chhattisgarh are around 75 million and 25 million respectively. Madhya Pradesh state has an agrarian economy. The major crops of Madhya Pradesh are wheat, soybean, gram, sugarcane, rice, maize, cotton, rapeseed, mustard and arhar. Minor Forest Produce (MFP), such as tendu leaves used to roll beedi, sal seed, teak seed, and lak also contribute to state's rural economy. Madhya Pradesh has 5 Special Economic Zones (SEZs): 3 IT/ITeS (Indore, Gwalior), 1 mineral-based (Jabalpur) and 1 agro-based (Jabalpur). Because of the state's central location, a number of consumer goods companies have established manufacturing bases in MP. The state has the largest reserves of diamond and copper in India. Other major mineral reserves include those of coal, coalbed methane, manganese and dolomite. Chhattisgarh accounts for 15% of the total steel produced in the country. Chhattisgarh is one of the fastest-developing states in India. Chhattisgarh is rich in minerals. It produces 20% of the country's total cement produce and ranks first in the nation for coal production and second in reserves, third in iron ore production and first in tin production.
Data Collection
The data was extracted from the Central Pollution Control Board (CPCB) report, which illustrates the values of various sub-index’s factors for air, water and land, as shown in Table 3, 4 and 5 respectively. The formula described in equation (1) is used to calculate the overall average CEPI, as shown in Table 6. Based on the values obtained from the average CEPI, the ranking of the industrial clusters is done using the guidelines mentioned in the CPCB report (2009). It is suggested that areas having aggregated CEPI scores of 65 and above should be considered as critically polluted areas, whereas the areas having CEPI between 45-65 should be considered as highly polluted areas and shall be kept under surveillance and pollution control measures should be efficiently implemented, whereas, the critically polluted clusters/ areas need detailed investigations in terms of the extent of dam age and an appropriate remedial action plan. The Table 7 and Table 8 explains the classification of the industrial sectors based on average CEPI score and further, their ranking respectively.

Table 5. Calculation of Land CEPI

Table 6. Calculation of Average CEPI

Table 7. Calculation of Average CEPI Score

Table 8. Normalization & Ranking of Industrial Clusters
Study Framework using Fuzzy Decision Analysis
The basic step in the process of fuzzy decision analysis is to form a fuzzy rule base to portray the overall pollution intensity for each industrial cluster; consisting of if-else statements connected with operators such as “AND” and “OR”, as shown in Table 9 (Singh et al., 2015; Srinivas et al., 2015). Finally, the industrial clusters have been classified using the fuzzy base rules as shown in Table 10.

Table 9. Fuzzy rule base formation for various industrial clusters

Table 10. Ranking of Industrial Clusters using Fuzzy Decision Base
Verification Using Integrated Fuzzy Assessment Model
The verification of the results obtained from integrated fuzzy assessment model has been done in this section. The basic principle involved is obtaining the value of the assessment factor U (i.e. Environmental Pollution Intensity) based on the three assessment grades G1, G2 and G3; as explained in equation (2), (3) and (4), as shown in Table 12. Table 11 illustrates the value of the various assessment grades for each industrial cluster.

Table 11. Industrial Cluster’s Pollution Level Value for each Assessment Grade

Table 12. Grade Classification of Assessment Indicator
Finally, the values of these membership function for each grade are being multiplied by the weights of each assessment indicator to obtain the final value of each assessment grade for each district. But since, in this case there is just one assessment indicator i.e. Environmental Pollution, the values remain as in shown in Table 11. As discussed earlier, we have taken a1 = 0.90, a2 = 0.50 and a3 = 0.05, the above values are being multiplied by the a-values so as to obtain the final score of each district as shown in Table 13.

Table 13. Final score of each industrial cluster
From the final score obtained, it is evident that Indore has the highest environmental pollution and Raipur having the lowest environmental pollution intensity. With an increase in CEPI, the environmental stability of the region is compromised and effecting the health and well-being of proximate areas.
The ranking of the various industrial clusters is Indore > Dewas > Nagpur > Raipur > Pitampur > Gwalior > Raipur. As it is evident from the Figure 3, the environmental sustainability potential in Raipur is high whereas the situation in Indore is not much optimistic with a final score of 0.5826. It is obvious that the sustainability in Indore is higher at the same time the exploitation of environment is also very high. The other five clusters have also reached the transition stage wherein the pollution’s level is approximately same, highly polluted. A similar pattern is obtained using the fuzzy decision base rule as explained in Section 3. The present CEPI is intended to act as an early sensor tool, which is easy and quick to use. It can help in categorizing the industrial clusters/areas in terms of priority. Step II involves a detailed assessment of various environmental indicators and investigation of the status of environmental resources such as land, vegetation, air, and water. The paper aggregates to various techniques for analysing the environmental pollution caused by the various industrial clusters and can be applied to a larger scale for further scope. There is an urgent need pay much attention in sustainability of environment for the development of economy and social justice. With rapid urbanization and excessive industrialization, the environment is tarnishing rapidly. It is, hence the need of hour to scrutiny the critical environment situation and curb the factors leading to such conditions at the source itself.

Fig. 3 Final Evaluation of status of Pollution in Industrial Clusters using Integrated Fuzzy Assessment Model.
Copyright © 2025 Research and Reviews, All Rights Reserved