
ISSN (0970-2083)
ISSN (0970-2083)
N.A. Siddiqui1, R.N. Shukla2* and Akbar Ziauddin3*
1University of Petroleum & Energy Studies, Dehradun (U.K.), India
2Ex Vice Chancellor, APS University, Rewa, India
3Akbar HSE Consulting, FZE, UAE
Received date: 21 July 2011; Accepted date: 30 August 2011
Visit for more related articles at Journal of Industrial Pollution Control
Cement, Industry, Groundwater quality
Cement plant is based on the latest dry process so the water requirement is quite low. The average consumption of water for township and plant is around 4582 KL /day, out of the total water around 1033.15 KL/ day is used in the colony while 3548.84 Kl/day is used in the plant.
Water is the basic and foremost necessity for the survival of any living being, plants and animals. It is also obvious that establishment and operation of any industry shall affect the water resources of the area.
The extent up to which impacts are likely on existing water resources depend upon the baseline quality of the water body and quality of effluent discharged by the new industry.
The water resources of study area broadly fall under the following two categories:
Surface water Resources
Includes Rivers, Streams, Lakes, Ponds etc,
Ground water Resources: Includes accumulated water in deeper strata of ground. The only source of replenishing these water resources is in the form of rainfall water which percolates into the ground during runoff.
The present study is done for the Comprehensive Environmental Impact Assessment and in this case the results of earlier study (EIA) were also available so an attempt is also made to make the comparison of water quality at the earlier stage with current water quality.
Ground Water Resources in Study Area
Ground water resources observed in study area had been mainly hand pumps, dug wells and bore wells. People in study area met their daily water requirement by hand pumps and dug wells whereas bore well mainly took care to the irrigation water requirement of the area. Cement Plant has been having number of bore wells to meet their plant and domestic water requirement.
Ground Water Sampling Locations
To analyze the ground water quality of the study area, ground water samples were collected from four locations mentioned as:
a) Location a
b) Location b
c) Location c
d) Location d
The sampling locations were selected in different directions in order to obtain the clear scenario of the ground water quality in the vicinity of plant area. The locations their aerial distances and directions with respect to cement plant are listed as. Table 1

Table 1: Location of sampling point
To analyze the ground water quality of the study area, for all the four locations i.e. Location a, Location b, Location c & Location d, water samples were collected, once in each season, these monitoring locations are the same from where earlier samples were collected, to asses the change in ground water quality in last 5-6 years. Samples were collected for all the four seasons. All the samples were collected using the spot sampling procedure.
Chemical analysis for each sample was done for 19 parameters in order to assess the ground water quality of the study area. The results obtained are presented (average results of all seasons) in Table 2 to 3.

Table 2: Average ground water quality in the study area Year-1998-99

Table 3: Average ground water quality in the study area Year-1993-94
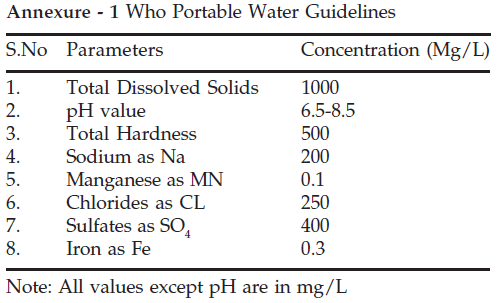
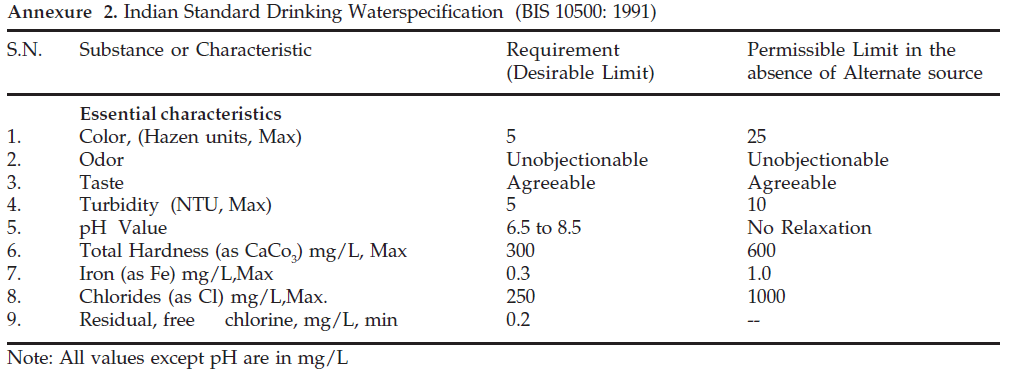
These results are compared with BIS drinking water standards (as per IS-10500: 1991) enclosed as Annexure -2 and WHO potable water guidelines enclosed as Annexure -1, which reveals following inferences.
Results Compared with BIS Drinking Water Standards
Following observations can be made by comparing the ground water quality results obtained for the study area (enclosed as Table 2 to 5) with BIS drinking water standards.
a. pH value of these water samples for all the four locations during all the four seasons varied from a maximum of 8.5 to a minimum of 8.05, which Shows that water was slightly basic in nature. However for the entire study period of one year pH value of ground water of study area for all the four locations were within the prescribed limit of BIS drinking water Standard of 6.5-8.5
b. Variation observed in the concentration of Turbidity, TDS, Total hardness, Calcium, Fluoride, Nitrates Manganese, Sulfates and Total Iron are as in Table.
Comparison of these results with BIS standards showed that-
• Turbidity, Fluorides, Nitrates, Manganese, Chlorides and Total Iron were within the BIS standards of t NTU (max), 1.0 mg/L (max), 45.0 mg/L (max), 0.1 mg/L (max), 25C) mg/L (max) and 0.3 mg/L (max) respectively.
• Concentration for Sulfates and Total Dissolved Solids exceeded the desirable BIS standards of 200 mg/L (max) and 500 mg/L (max) respectively, however were within the BIS extended limits of 400 mg/L (max) and 200 mg/L (max) respectively.
• Total Hardness of the water samples exceeded the BIS desirable limits of 300 mg/L (max) for most of the seasons. This is due to the high calcium concentration (may be present in form of carbonates) which also exceeded the BIS standards of 75 mg/L (max) for most of the seasons. These values also were within the extended, limit of 600 mg/L (max) and 200 mg/L (max).
In the Light of above observations it can be deduced that the ground water quality of the study area have not complied with the desirable limits of BIS drinking water standards, however it met the permissible limits of BIS drinking water standards.
Result Compared with WHO Potable Water Guidelines
The comparison of ground water results (average results) obtained for the study period (enclosed as Table 2 to 3) with WHO potable water guidelines (enclosed as Annexure–1) revealed that most of the parameters were well below the WHO potable water guidelines. Total Hardness exceeded the prescribed limits of 500 mg/L (max) but the difference was negligible.
Hence it can be stated that the ground water quality of the study area met the WHO potable water guidelines.
In the light of the above comparisons it can be deduced that the ground water quality of the study area for all the four locations needed some primary treatment and disinfection before using for drinking purpose.
Comparative Study for Ground water Quality with the Previous Study Results
Ground water results were compared with the previous study results, which is presented inTables 6 to 9.
1. Location A
When we compared the ground water results of the recent study with the previous study it was clear that most of the parameters showed higher results taken as the average of all four seasons,while some parameters showed identical values. Parameters like total solids, total hardness, alkalinity and iron shows higher results and reasons for the higher values could be due to constant use and replenishment of ground water resources. The mineral beds in contact with water table led to slight changes in characteristics noted in these observations.
2. Location B
Average ground water characteristics of location b showed variation from the previous study and this could be is due to the increase in mining activity in surrounding localities.
3. Location C
When average ground water results of location c were compared with the average ground water results of previous study, following conclusion can be drawn.
There was sharp increase in the total dissolved solids, total hardness, permanent hardness, conductivity sulphate and sodium as well as in pH values.
While phosphates, which were absent in the previous study results showed reading of 2.39 mg/ L in the present study. This could be due to the constant use and replenishment of ground water resources.
4. Location D
Comparative average results of location d showed that some values were on the higher side as compared to the previous study while some were identical and some showed lesser concentration from the previous study.
Total solids, total hardness temporary hardness, calcium, magnesium, pH, total alkalinity, conductivity were slightly on the higher side. While phosphates which was absent in the previous study, showed reading of 2.50 mg/ L.
The time has come when industrialist should take appropriate measures to reduce the water consumption and on the other hand scientist should developed latest technologies to change the current water extensive unit/process to less water consuming process to save the precious matter. Changing of wet process to dry process for making cement could be a good example of this.
Impact of forest removal and ozone layer depletion is now a day’s daily column in most of the renowned newspapers but time has come when every single person has to think, gain knowledge and act in the direction to save the earth and its natural resources.
Copyright © 2025 Research and Reviews, All Rights Reserved