
ISSN (0970-2083)
ISSN (0970-2083)
Ravi Vital Kandisa1*, Narayana Saibaba Kv1, Gopinadh R1 and K Veerabhadram2
1Department of Biotechnology, GITAM Institute of Technology, GITAM, India.
2Department of Civil Engineering, GITAM Institute of Technology, GITAM, India
Received 11 July, 2018; Accepted 11 August, 2018
Visit for more related articles at Journal of Industrial Pollution Control
In the present study, the main aim is to remove methylene blue (MB) from aqueous solution using natural biosorbent by adsorption process. Vigna Trilobata pod was used as a potential biosorbent for the removal of methylene blue under different experimental conditions. Four kinetic models, pseudo first order, pseudo second order, Elovich and Weber Morris Intra Particle Diffusion models, were examined to find the biosorption kinetics. The results showed that pseudo second order is the best fit model with the correlation coefficient of R2 ≥ 0.99. These experimental results proved that Vigna Trilobata pod can be used as a low cost natural biosorbent for the removal of methylene blue.
Chemical pollution, Environment degradation, Dye, Textile industries, Biosorption, Adsorption.
Chemical pollution due to waste water discharge from industries is a noteworthy cause of environment degradation which affects both ecology as well as human health. Dyes are imperative raw materials for most of the major industries such as textile, leather, tanning, paint etc. Chemically and thermally stable synthetic dyes are the first choice of textile industrialists due to their long-term effective results (Ravi, et al., 2016). Aqueous contamination by these chemically and thermally stable dyes poses hazardous effects on human and animals (Narayana Saibaba KV, et al., 2012); their toxicity alters the physiochemical mechanisms of the body upon consumption and act as potential mutagen that is able to induce cancer (Joshi and Santani, 2012).
Methylene blue is a synthetic dye widely used in cotton and wool industries. Chemically it is heterocyclic aromatic tetra methyl thionine chloride which is cationic in nature. The aromatic structure of methylene blue provides its chemical stability. It is used as a diagnostic agent in cardiac dysfunction and also for treating cynide toxicity. Acute exposure of this dye yields symptoms like shock cyanosis, vomiting, jaundice and tissue necrosis (El-Ashtoukhy and Fouad, 2015; Narayana Saibaba KV, et al., 2013), whereas chronic exposure is harmful enough to cause mutagenesis.
Effluent containing dyes are usually treated by using various physico-chemical methods such as coagulation, ion-exchange, sedimentation, dialysis, electrophoreses, adsorption etc. Among these the most effective and commonly used method for treating dye contaminated waste water is adsorption as cost of other biological and chemical processes is exorbitant. Modern day research is being focused on more efficient and cost-effective treatment processes. Industrially activated carbon is widely used as the adsorbent for dye removal process. However, adsorption technique using non-conventional approach holds a good promise in future; hence use of low-cost, natural biodegradable adsorbents is the new question of debate for the environmentalists. These products involve cellulose rich agricultural waste (Mohd, et al., 2010, Narayana Saibaba KV and King, 2013), processed materials like graphene (Tonghao, et al., 2012). These bio-adsorbents are environment friendly, commercially inexpensive, easily available and ensure complete safety (Narayana Saibaba K.V and King, 2016).
1. Raw materials
Collection of Vigna Trilobata pod, which is used as a test adsorbent in this study, was done from natural sources and distilled water was used for purification of adsorbent.
2. Chemicals
Preparation of stock solution of methylene blue (Sigma-Aldrich, M) was done by adding 1.0 g of methylene blue in 1L of distilled water. This stock solution was diluted to prepare test solutions of various required concentrations.
3. Kinetic Studies
To carry out adsorption kinetics experiments, 50 ml of methylene blue solution with an initial concentration of 25 ppm was taken in an Erlenmeyer flask of 250 ml capacity. The pH of the solutions was adjusted to 7 with 0.1N NaOH and 0.1N HCl solutions. The temperature of the solution was maintained at 30 0C and then biosorbent of 0.2 g was added. These flasks were agitated at 130 rpm in water-bath shaker. During agitation, samples from these solutions were taken at different time intervals and subjected to centrifugation at 4000 rpm for 10 min. Then final concentrations of supernatant solutions were measured using UV-vis Spectrophometer at 665 nm wavelength. This procedure was repeated for other methylene blue dye solutions having different initial concentrations, i.e., 50 ppm, 75 ppm, 100 ppm, 125 ppm and 150 ppm.
Once the initial and final concentrations were recorded, the adsorption capacity, qt (mg/g) was deduced using the formula
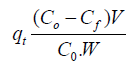
Where, C0 (mg/L) is the initial liquid phase concentration of methylene blue, Cf (mg/L) is the liquid phase concentration of methylene blue at time t. V (L) is the volume of solution taken in flask and W is the mass of biosorbent (g) which was taken as constant during the experiment.
Pseudo first order kinetic model:
Pseudo first order kinetic model is represented as
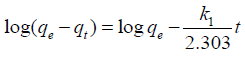
Where k1 is the rate constant of pseudo first order equation and qe denotes the amount of adsorption at equilibrium. If the R2 value is close to 1, kinetic model best fits to Pseudo first order reaction, and it indicates that the reaction is more inclined towards physisorption.
Pseudo second order kinetic model is represented as,
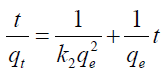
k2 = pseudo second order adsorption rate constant (g/mg·min)
qt = amount of dye adsorbed at time t (mg/g)
qe = amount of dye adsorbed at equilibrium (mg/g)
t = time of biosorption (min)
For pseudo second order kinetics, the value of k2 (second order rate constant) depends on the operating conditions such as initial pH and solution concentration, temperature, agitation rate etc. (Naidu, et al., 2013). It also decreases as the initial solution concentration increases, since it takes a longer time to reach equilibrium. If the reaction fits well to pseudo second order model it indicates an inclination towards chemisorption (Ho and Mckay, 1998).
The Elovich equation has been widely used in adsorption kinetics, which describes chemical adsorption mechanism in nature. Elovich model is used to determine the rate constants (adsorption rate and desorpotion rate). Elovich's equation is not a kinetic equation, but an equation by means of which one can approximate a single kinetic curve, and only in a limited range of time changes (logarithmic function).
The Elovich equation is generally expressed as follows:
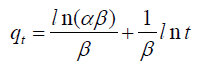
Where qt is the sorption capacity at time t (mg g-1), α is the initial sorption rate (mg g-1 min-1) and β is the desorption constant (g mg-1). Thus, the constants have been obtained from the slope and the intercept of a straight-line plot of qt against ln (t) can be used to test the applicability of the Elovich equation to the kinetics of sorption. The Elovich equation is also based on the adsorption capacity (Bahnika, et al., 2015).
Intraparticle diffusion model
Weber and Morris have proposed an intraparticle diffusion model which is widely applied or used to study the analysis of adsorption kinetics (Feng-Chin, et al., 2009). This model was applied to evaluate the rate-limiting steps of the biosorption processes (Bao-E, et al., 2008). According to the Weber Morris equation, if a plot qt versus t1/2 is straight line with a slope k then intraparticle diffusion is the rate determining step of the process. When the line does not pass through the origin then the intraparticle diffusion could be accompanied with slow film diffusion (Ilie, et al., 2010). The Weber and Morris intraparticle diffusion model is generally expressed as follows:
Results and Discussion
Effect of initial concentration and contact time on methylene blue biosorption:
The effect of initial dye concentrations (25–150 mg/L) on the adsorption capacity of Vigna Trilobata pod is shown in Fig. 1. At every concentration, the figure shows rapid adsorption rate during initial period and thereafter it was slowed down until getting saturated. Furthermore, the results revealed that the contact time needed for methylene blue solutions with initial concentrations of 25–150 mg/L to reach equilibrium was 60 min. Thereafter, biosorbent saturated and no adsorption took place. Therefore, the driving force which was supplied by the initial concentration is very important to overcome all mass transfer resistances of the methylene blue between the aqueous and solid phase. Vigna Trilobata pod biosorbent required at least 20 min to overcome all mass transfer resistances and it required 60 min time for full equilibrium. When concentration was changed from 25 ppm to 150 ppm, the equilibrium adsorption increased from 6.59 to 30.28 mg/g level.

Fig. 1 Effect of contact time and initial dye concentration on the biosorption of methylene blue onto Vigna Trilobata pod
Adsorption kinetics
Biosorption rate of methylene blue onto the Vigna Trilobata pod and controlling mechanism of the biosorption process was analyzed using pseudo first order, pseudo second order, Elovich and Weber Morris Intra Particle Diffusion kinetic models.
Pseudo first order kinetics
Rate of methylene blue adsorption onto the Vigna Trilobata pod material was analysed using pseudo first order kinetic model. The graph was plotted log (qe-qt) against t. The slope of the plotted graph log (qe-qt) against t gives the rate constant relevant to the Vigna Trilobata pod. It was observed from Table 1, pseudo first order kinetics has the high values of regression coefficient. The data well fits to the pseudo first order kinetic model which indicates that biosorption process is physisorption (Fig. 2).

Fig. 2 Pseudo first order kinetics for biosorption of methylene blue onto Vigna Trilobata pod.
| C0 (mg/L) | qe (mg/g) | k1 (1/min) | R2 |
|---|---|---|---|
| 25 | 6.59366755 | 0.0753081 | 0.977 |
| 50 | 13.7255937 | 0.0803747 | 0.9641 |
| 75 | 16.7068966 | 0.082908 | 0.9743 |
| 100 | 22.3377309 | 0.0861322 | 0.9675 |
| 125 | 28.7968338 | 0.089817 | 0.9516 |
| 150 | 30.2770449 | 0.078302 | 0.9708 |
Table 1 Pseudo first order kinetic model parameters for biosorption of methylene blue dye onto Vigna Trilobata pod.
Pseudo second order kinetics
Rate of methylene blue adsorption into the Vigna Trilobata pod material was analysed using pseudo second order kinetic model. The graph was plotted t/qt against t. The slope of the plotted graph gives the rate constant relevant to the Vigna Trilobata pod. It was observed from Table 2, pseudo second order kinetics has high values of regression coefficient (R2 ≥ 0.99) than the Pseudo first order kinetics. The data well fits to the pseudo second order kinetic model which indicates that biosorption process is chemisorption (Fig. 3).

Fig.3 Pseudo second order kinetics for adsorption of methylene blue onto Vigna Trilobata pod
| C0 (mg/L) | qe (mg/g) | k2 (1/min) | R2 |
|---|---|---|---|
| 25 | 6.593667546 | 0.119984127 | 0.9998 |
| 50 | 13.72559367 | 0.045213656 | 0.9997 |
| 75 | 16.70689655 | 0.037831926 | 0.9998 |
| 100 | 22.33773087 | 0.031216691 | 0.9998 |
| 125 | 28.79683377 | 0.023101491 | 0.9998 |
| 150 | 30.27704485 | 0.022445886 | 0.9998 |
Table 2: Pseudo second order kinetic model parameters for biosorption of methylene blue dye onto Vigna Trilobata pod.
Rate of methylene blue adsorption into the Vigna Trilobata pod material was analysed using Elovich kinetic model. The graph was plotted ln (t) against qt. The slope of the plotted graph ln (t) against qt gives the rate constant relevant to the Vigna Trilobata pod. The correlation coefficients were identified and listed in Table 3. The data does not fit well to the Elovich model when compared with pseudo second order kinetic model (Fig. 4).

Fig. 4 Elovich kinetics plot for the biosorption of methylene blue onto Vigna Trilobata pod
| C0 (mg/L) | α | β | R2 |
|---|---|---|---|
| 25 | 407.6426927 | 1.619957881 | 0.9647 |
| 50 | 171.1138736 | 0.648130145 | 0.9595 |
| 75 | 153.7323847 | 0.509087207 | 0.9411 |
| 100 | 519.2212781 | 0.428393951 | 0.9526 |
| 125 | 555.8075824 | 0.325383139 | 0.9498 |
| 150 | 833.2959591 | 0.323519896 | 0.9676 |
Table 3 Elovich model parameters for removal of methylene blue dye onto Vigna Trilobata pod adsorbent.
Weber Morris Intra Particle Diffusion was used to analyse methylene blue adsorption rate onto the Vigna Trilobata pod material. The graph was plotted qt versus t1/2. The slope of the plotted graph qt against t1/2 gives the rate constant relevant to the Vigna Trilobata pod. The ki values can be seen from the comparison of the results in Table 4. It was observed that intra-particle rate constant values (ki) increased with solution concentration (Fig. 5).

Fig. 5 Weber Morris Intra Particle Diffusion plot for the adsorption of methylene blue onto Vigna Trilobata pod adsorbent.
| C0 (mg/L) | R12 | ki1 | I1 | R22 | ki2 | I2 |
|---|---|---|---|---|---|---|
| 25 | 0.9595 | 0.9471 | 2.8791 | 0.6281 | 0.0804 | 5.8663 |
| 50 | 0.9159 | 1.6488 | 5.7036 | 0.462 | 0.1177 | 12.644 |
| 75 | 0.9528 | 3.0779 | 4.8941 | 0.65 | 0.1861 | 15.021 |
| 100 | 0.9007 | 4.1007 | 7.2501 | 0.5293 | 0.3003 | 19.645 |
| 125 | 0.8125 | 3.6212 | 11.732 | 0.4477 | 0.1778 | 27.164 |
| 150 | 0.8493 | 3.652 | 12.945 | 0.5147 | 0.2145 | 28.299 |
Table 4 Weber Morris Intra Particle Diffusion parameters for biosorption of methylene blue dye onto Vigna Trilobata pod adsorbent.
Four kinetic models pseudo first order, pseudo second order, Elovich and Weber Morris Intra Particle Diffusion were examined to find the adsorption kinetics. The results described that pseudo second order is the best fit model with the correlation coefficient of R2 ≥ 0.99. The conclusion drawn from the Weber-Morris intra particle plots is that intra particle diffusion accompanied with film diffusion was the rate controlling mechanism in this biosorption process. These experimental results proved that Vigna Trilobata pod has highest surface phenomenon can be used as a low-cost natural adsorbent for the removal of methylene blue.
Copyright © 2025 Research and Reviews, All Rights Reserved